Gentrification remains rare nationally. It did, however, greatly accelerate in many cities over the past decade. The following table summarizes the extent to which neighborhoods in Boston gentrified:
| Share of Eligible Tracts Gentrifying | Tracts Gentrifying | Did Not Gentrify | Not Eligible to Gentrify | Total Census Tracts | |
|---|---|---|---|---|---|
| Since 2000 | 21.1% | 12 | 45 | 122 | 179 |
| 1990-2000 | 6.7% | 5 | 70 | 104 | 179 |
Gentrifying Census Tracts: These lower-income Census tracts experienced significant growth in both home values and educational attainment. To be eligible to gentrify, a tract's median household income and median home value needed to fall within the bottom 40th percentile of all tracts within a metro area at the beginning of the decade. Tracts considered to have gentrified recorded increases in the top third percentile for both inflation-adjusted median home values and percentage of adults with bachelors’ degrees.
Tracts Not Gentrifying: These Census tracts met eligibility criteria, but did not experience enough growth in educational attainment and median home values relative to other tracts within a metro area to have gentrified.
Not Eligible Tracts: These tracts, typically middle and upper-income neighborhoods, did not meet the initial criteria for gentrification. To be eligible to gentrify, a tract's median household income and median home value both needed to be in the bottom 40th percentile of all tracts within a metro area at the start of a decade. Tracts with less than 500 residents or missing data were also considered not eligible.
- Read Governing's national gentrification report
- Complete methodology
- Gentrification data for other cities
- Read Governing's gentrification coverage
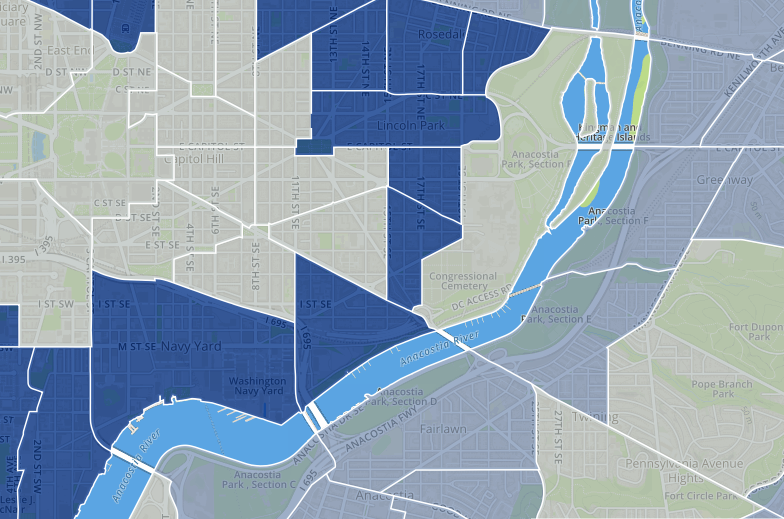
Boston Gentrification Map: 2000 Census - Present
Click a tract to display its demographic data:Map Key
|
|
Tract gentrified |
|
|
Tract did not gentrify |
|
|
Tract not eligible to gentrify |
NOTE: Data shown correspond to current tract boundaries, which may have changed from prior Census years. Figures are calculations from 2009-2013 American Community Survey estimates.
Boston Gentrification Map: 1990 Census - 2000 Census
NOTE: Data shown correspond to current tract boundaries, which may have changed from prior Census years. Estimates are from the US2010 Longitudinal Tract Data Base project of the Russell Sage Foundation and Brown University.
Map Data Definitions
Gentrification Status: See summary above.Median Home Value: Estimates are shown for owner-occupied housing units in 2013 dollars for recent data and 1999 dollars for 2000 Census data. Percentage changes in home values reflect adjustments for inflation.
Bachelor’s Degrees: The share of the population age 25 and older who report holding bachelor’s degrees.
Median Household Income: Values shown in 2013 dollars for recent data and 1999 dollars for 2000 Census data.


