Internet Explorer 11 is not supported

For optimal browsing, we recommend Chrome, Firefox or Safari browsers.

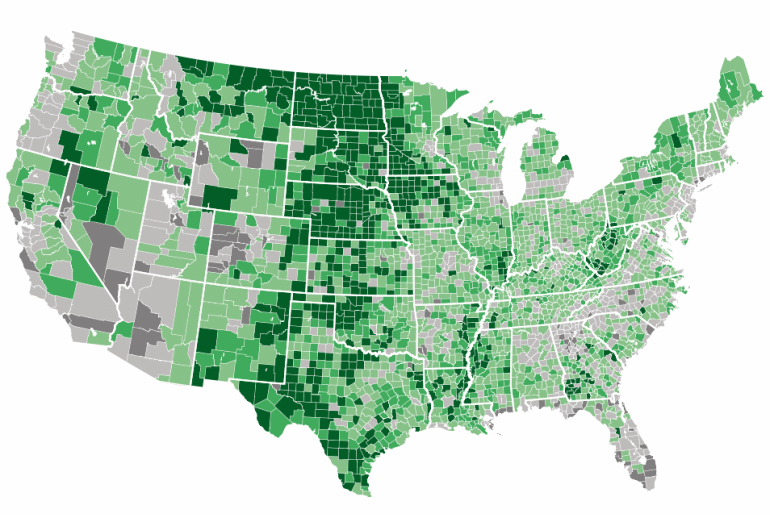
Personal Income Per Capita Growth for U.S. Counties Map

View changes in real per capita personal income for counties on our interactive map.

While per capita personal income had just about returned to pre-recession levels in 2012, incomes grew far faster in select counties across the country, mostly in Great Plains states.

The following map shows changes in per capita personal income, by U.S. county, between 2007 and 2012. Income data was compiled from the U.S. Bureau of Economic Analysis and adjusted for inflation using CPI-U.

Please pan the map to view Alaska and Hawaii.


2007-2012 Per Capita Personal Income (Inflation-Adjusted) Change


 <-7%  >=-7%   >0%   >7%   >14%

Mike Maciag is Data Editor for GOVERNING.