The national age-adjusted suicide rate was 13.5 deaths per 100,000 population. The rate has slowly ticked up in recent years and currently stands at one of the highest levels seen in decades.
Suicide rates vary greatly across different regions of the country. Research indicates that demographics, access to care, the availability of firearms and cultural differences are among several factors that influence numbers of suicides. In general, rural and outlying county jurisdictions have recorded the highest suicide rates:
| County Urbanization | Population | 2016 Suicide Rate |
|---|---|---|
| Non-Core Area | Outside of MSAs and micropolitan areas | 18.9 per 100k |
| Micropolitan Area | Urban cluster: 10,000 - 49,999 | 17.4 per 100k |
| Small Metro Area | Less than 250,000 | 16.3 per 100k |
| Medium Metro Area | 250,000 - 999,999 | 15 per 100k |
| Large Fringe Metro Area | 1 million or more | 12.3 per 100k |
| Large Central Metro Area | 1 million or more | 10.6 per 100k |
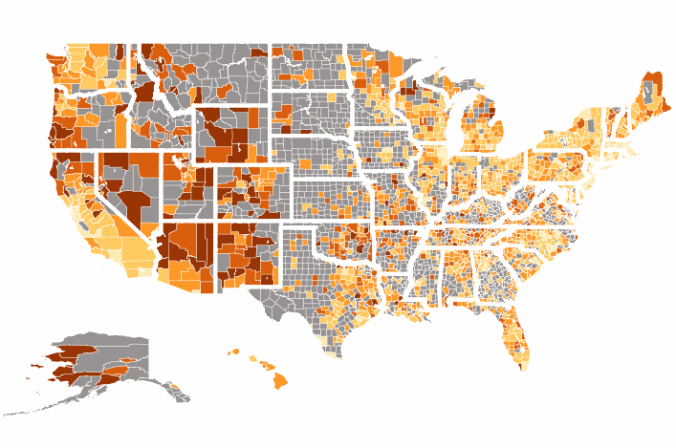
The following map depicts annual average age-adjusted suicide rates for counties between 2012 and 2016. Rural and western areas typically experienced higher numbers of suicides, as they have historically. Data was unavailable or considered to be unreliable for many mostly less-populated areas, shown in gray.
2012-16 Average Annual Suicides Per 100,000
|
|
|
|
|
|
|
|
|
| > 0 | >= 10 | >= 15 | >= 20 | >= 25 | Data not reported |
SOURCE: 2012-16 average annual age-adjusted suicide rates obtained from National Center for Health Statistics, CDC WONDER online database


