
To assess the extent to which gentrification has reshaped urban communities, Governing analyzed Census tract data for the nation’s 50 largest cities. Main findings from the neighborhoods examined include:
Gentrification greatly accelerated in several cities. Nearly 20 percent of neighborhoods with lower incomes and home values have experienced gentrification since 2000, compared to only 9 percent during the 1990s.
Gentrification sill remains rare nationally, with only 8 percent of all neighborhoods reviewed experiencing gentrification since the 2000 Census.
Compared to lower-income areas that failed to gentrify, gentrifying Census tracts recorded increases in the non-Hispanic white population and declines in the poverty rate.
Researchers define gentrification differently. For this report, an initial test determined that a tract was eligible to gentrify if its median household income and median home value were both in the bottom 40th percentile of all tracts within a metro area at the beginning of the decade. To assess gentrification, growth rates were computed for eligible tracts’ inflation-adjusted median home values and percentage of adults with bachelors’ degrees. Gentrified tracts recorded increases in the top third percentile for both measures when compared to all others in a metro area. (Read complete methodology)
Where Gentrification is Occurring
A select group of cities experienced extensive gentrification in recent years. Perhaps nowhere were changes more visible than in Portland, where 58 percent of eligible tracts gentrified – more than any other city reviewed. Comparing 2000 data to the most recent Census estimates suggests at least half of lower-income neighborhoods also gentrified in Minneapolis, Seattle and Washington, D.C. In terms of raw totals, the highest number of tracts (128) gentrified in New York.The following table shows cities’ gentrification rates and tract counts for the period since the 2000 Census:
| City | Share of Eligible Tracts Gentrifying | Gentrified Tracts | Did Not Gentrify | Not Eligible to Gentrify | Total Tracts |
|---|---|---|---|---|---|
| Portland, OR | 58.1% | 36 | 26 | 80 | 142 |
| Washington, DC | 51.9% | 54 | 50 | 75 | 179 |
| Minneapolis, MN | 50.6% | 39 | 38 | 39 | 116 |
| Seattle, WA | 50% | 7 | 7 | 118 | 132 |
| Atlanta, GA | 46.2% | 30 | 35 | 62 | 127 |
| Virginia Beach, VA | 46.2% | 6 | 7 | 86 | 99 |
| Denver, CO | 42.1% | 24 | 33 | 87 | 144 |
| Austin, TX | 39.7% | 25 | 38 | 119 | 182 |
| Sacramento, CA | 30% | 15 | 35 | 54 | 104 |
| New York, NY | 29.8% | 128 | 301 | 1723 | 2152 |
| Oakland, CA | 29.3% | 24 | 58 | 31 | 113 |
| Philadelphia, PA | 28.7% | 84 | 209 | 90 | 383 |
| Albuquerque, NM | 28.1% | 9 | 23 | 95 | 127 |
| San Diego, CA | 27.5% | 22 | 58 | 202 | 282 |
| Baltimore, MD | 23.2% | 39 | 129 | 32 | 200 |
| Long Beach, CA | 22.4% | 11 | 38 | 62 | 111 |
| Fort Worth, TX | 21.5% | 17 | 62 | 71 | 150 |
| Omaha, NE | 21.4% | 12 | 44 | 75 | 131 |
| Nashville, TN | 21.1% | 12 | 45 | 96 | 153 |
| Boston, MA | 21.1% | 12 | 45 | 122 | 179 |
| San Francisco, CA | 18.8% | 3 | 13 | 180 | 196 |
| Houston, TX | 18.4% | 35 | 155 | 271 | 461 |
| Colorado Springs, CO | 17.6% | 6 | 28 | 61 | 95 |
| Chicago, IL | 16.8% | 54 | 268 | 473 | 795 |
| Jacksonville, FL | 16.2% | 11 | 57 | 95 | 163 |
| Charlotte, NC | 15.8% | 9 | 48 | 137 | 194 |
| Los Angeles, CA | 15.1% | 51 | 287 | 661 | 999 |
| Phoenix, AZ | 14.2% | 20 | 121 | 214 | 355 |
| Oklahoma City, OK | 13.2% | 9 | 59 | 128 | 196 |
| Raleigh, NC | 13% | 3 | 20 | 59 | 82 |
| Kansas City, MO | 12.8% | 10 | 68 | 70 | 148 |
| Miami, FL | 12.8% | 5 | 34 | 58 | 97 |
| Indianapolis, IN | 12.2% | 12 | 86 | 109 | 207 |
| Columbus, OH | 12.2% | 11 | 79 | 117 | 207 |
| Milwaukee, WI | 12.1% | 16 | 116 | 77 | 209 |
| Mesa, AZ | 12.1% | 4 | 29 | 77 | 110 |
| San Antonio, TX | 11.7% | 14 | 106 | 165 | 285 |
| Fresno, CA | 11.4% | 5 | 39 | 69 | 113 |
| Wichita, KS | 11.4% | 5 | 39 | 57 | 101 |
| Louisville, KY | 10.6% | 7 | 59 | 97 | 163 |
| Dallas, TX | 10.2% | 13 | 114 | 167 | 294 |
| San Jose, CA | 10% | 7 | 63 | 125 | 195 |
| Memphis, TN | 8.8% | 7 | 73 | 91 | 171 |
| Tucson, AZ | 8.3% | 4 | 44 | 74 | 122 |
| Tulsa, OK | 7% | 3 | 40 | 80 | 123 |
| Cleveland, OH | 6.7% | 10 | 139 | 28 | 177 |
| Detroit, MI | 2.8% | 7 | 243 | 46 | 296 |
| Las Vegas, NV | 2% | 1 | 48 | 100 | 149 |
| El Paso, TX | 0% | 0 | 27 | 104 | 131 |
| Arlington, TX | 0% | 0 | 19 | 52 | 71 |
Source: Governing analysis of 2009-2013 American Community Survey, US2010 Longitudinal Tract Data Base
While it has become much more prevalent, gentrification remains a phenomenon largely confined to select regions, not yet making its way into most urban areas. In the majority of cities reviewed, less than a one-fifth of poorer, lower priced neighborhoods experienced gentrification. If all city neighborhoods are considered -- including wealthier areas not eligible to gentrify -- less than one of every ten tracts gentrified. Cities like Detroit, El Paso and Las Vegas experienced practically no gentrification at all.
How Gentrification Accelerated
The initial seeds of gentrification date back several decades in some communities. In fact, a British sociologist first coined the term “gentrification” in 1963.Gentrification particularly accelerated, though, in recent years as growing numbers of Americans opted for urban lifestyles. The gentrification rate, or share of eligible lower-income tracts experiencing gentrification, was 20 percent for the period following the 2000 Census, more than double the rate of the 1990s. Rates increased in 39 of the 50 cities reviewed.

Some cities experienced rapid gentrification after decades of little or no economic growth. In the District of Columbia, for example, 54 neighborhoods were found to have gentrified since 2000. Back in the 1990s, just five neighborhoods had gentrified in a decade when the city was dubbed the nation’s “murder capital.”
Other neighborhoods began their transition decades ago. In San Francisco, for instance, few tracts were eligible to gentrify in 2000 as much of the city’s housing stock had already increased in price by then.
It’s important to note that Census Bureau estimates provide only snapshots of different times. So, depending on when a neighborhood gentrified, it may or may not be reflected in data over a 10-year period.
Characteristics of Gentrifying Neighborhoods
Distinct differences emerge between neighborhoods that gentrified and those that haven’t. Neighborhoods gentrifying since recorded population increases and became whiter, with the share of non-Hispanic white residents increasing an average of 4.3 percentage points. Meanwhile, lower-income neighborhoods that failed to gentrify experienced slight population losses and saw the concentration of minorities increase. They have also experienced different economic fates: Poverty rates climbed nearly 7 percent in already lower-income tracts that didn’t gentrify, while poverty rates dropped slightly in gentrifying neighborhoods.| Neighborhood Type | Tract Count | Total Population Change | White Non-Hispanic Share of Pop. Percentage-Point Change | Poverty Rate Percentage-Point Change |
|---|---|---|---|---|
| Gentrifying Tracts | 948 | 6.5% | +4.3 | -0.7 |
| Gentrification-Eligible Tracts Not Gentrifying | 3,802 | -2.4% | -5.0 | +6.7 |
| All Tracts (includes ineligible tracts) | 11,829 | +9.7% | -4.5 | +3.6 |
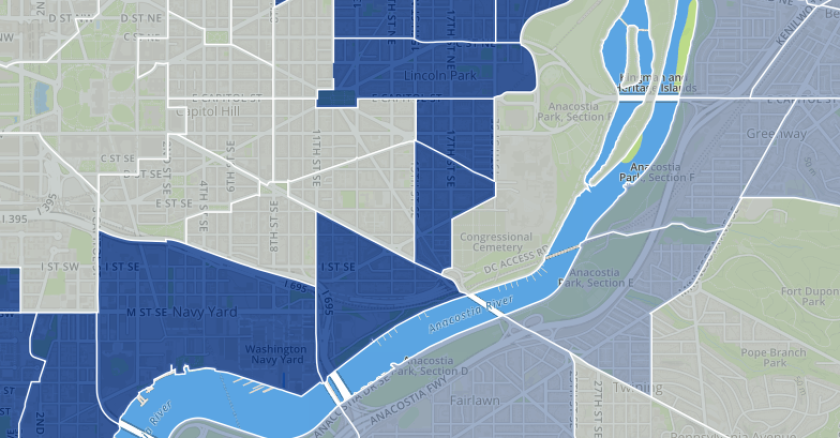
Maps
Gentrification Maps and Data for Other Cities
Profiles of Select Cities
Minneapolis: After experiencing little change during the 1990s, 39 Minneapolis neighborhoods gentrified over the past decade.Key drivers of the city’s transformation are fairly typical of other gentrifying cities. Kjersti Monson, the city’s director of long-range planning, citied the role of infrastructure investments, particularly light rail, a parks system and two new stadiums downtown. The timing of these investments, she said, coupled with recent national trends in valuing urbanity, set the table for the city’s demographic shift.
“There has been a huge renaissance downtown,” Monson said, “and it has brought a lot of wealth, empty nesters and investors.” Young professionals seeking urban amenities also are attracted to the area’s affordability.
Portland: Northeast Portland is home to some of the city’s oldest neighborhoods. Once characterized by an abundance of affordable housing and several predominantly African-American neighborhoods, it is today one of the hottest parts of one of the hottest cities for young professionals.
Other parts of the city experienced similar revitalization. In all, 58 percent of Portland’s lower-priced neighborhoods gentrified since 2000, the highest rate of any city reviewed. An initial wave started back the early 1990s, and young processionals continue to flock to the city today. “Portland, in some ways, was at the forefront of the return to urban living,” said Linda Bates, director of the Center for Urban Studies at Portland State University.
The city now faces significant pressures in maintaining housing affordability and neighborhood diversity. Bates said many former residents of Northeast Portland were displaced over the years, eventually moving to outlying communities on the city’s east side. “There is a lot of conversation here looking at other cities and saying that we don’t just want to be a playground for wealthy people,” she said.
Map Key
|
| Tract gentrified |
|
| Tract did not gentrify |
|
| Tract not eligible to gentrify |
NOTE: Data shown correspond to current tract boundaries, which may have changed from prior Census years. Figures are calculations from 2009-2013 American Community Survey estimates.
