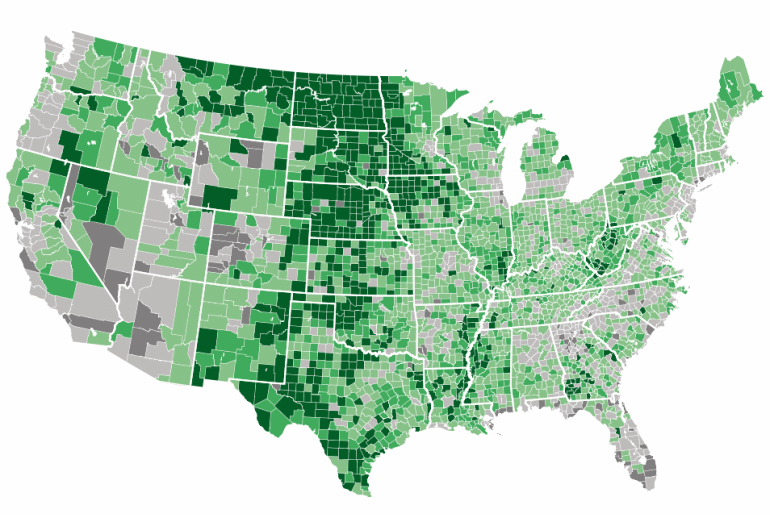
The following map shows changes in per capita personal income, by U.S. county, between 2007 and 2012. Income data was compiled from the U.S. Bureau of Economic Analysis and adjusted for inflation using CPI-U.
Please pan the map to view Alaska and Hawaii.
2007-2012 Per Capita Personal Income (Inflation-Adjusted) Change
|
|
|
|
|
|
| <-7% | >=-7% | >0% | >7% | >14% |


