

However, the surge in collections did not last. Annual inflation-adjusted state tax revenue fell in fiscal year 2023 from the prior year—the only time in at least 40 years that real revenue has declined outside of a recession. More than three dozen states saw their revenue shrink, including a steep decline in California; in fiscal 2024, at least five states reported shortfalls.
As of mid-2024, after more than a year of quarterly inflation-adjusted tax revenue declines, the pandemic-era surge had clearly ended. By fall 2023, most states were reporting real revenue declines compared with the prior year, and lawmakers in at least five states had budget shortfalls to close during the 2024 legislative session. As states enter this new chapter, policymakers are facing difficult questions: How long will revenue drop or stagnate? Do tax cuts or spending increases enacted in recent years rely on growth that may not materialize? What will sustainable growth look like going forward?
Approximately 38 percent tax revenue growth over three years—or $152 billion—exceeded pre-pandemic growth trends and may have been temporary in nature. From calendar year 2020 through 2022, 35 states collected more tax revenue than they were on pace for, based on pre-pandemic growth trends. The portion of new growth that was above trend varied widely across states, ranging from more than 90 percent in Mississippi and New Mexico to less than 20 percent in Pennsylvania and Virginia.
Cumulative collections in 15 states performed below their pre-pandemic trend line during the revenue wave, though most of them still had positive revenue gains after the brief recession. These should consider the possibility that inflation may have masked relatively tepid revenue growth. The breaking of the revenue wave may signal future fiscal strain for these states.
States received more than $800 billion from the federal government to help combat the pandemic’s negative economic impacts. Individuals also received stimulus funds that temporarily bolstered consumer spending and associated sales tax revenue. As the increased aid helped lift the economy, 48 states passed tax cuts or one-time rebates. Both the record-setting level of federal aid and the sheer volume of tax relief ultimately hindered states’ ability to identify the full scope of the revenue wave. The new pace of growth was not sustainable and revenue collections have subsided.
In early 2023, the revenue wave crested. Now, in fiscal 2025 and looking ahead, budget pressures are increasing as revenue begins to dip below pre-pandemic trends. Although policymakers understood that the revenue wave was temporary, states’ practices for measuring potentially one-time revenue vary and formal adoption of leading practices is limited. States can better understand revenue swings by creating formal definitions of above-trend revenue and recording what portion of revenue may be temporary versus ongoing in official estimates and budget documents. Forward-looking analytical tools such as long-term budget assessments also allow states to estimate the revenue outlook and can help them determine what level of collections are sustainable for the future.
Watching the Trend Lines
Understanding and forecasting revenue growth rates in the current climate is made more difficult by the wind down of federal pandemic aid, inflation and other lingering economic uncertainties, and the ongoing impact of recent tax policy changes. By making a regular practice of distinguishing between temporary and recurring revenue and by taking the long view on the budgeting cycle, state lawmakers can more confidently budget for policy changes even during volatile economic times.
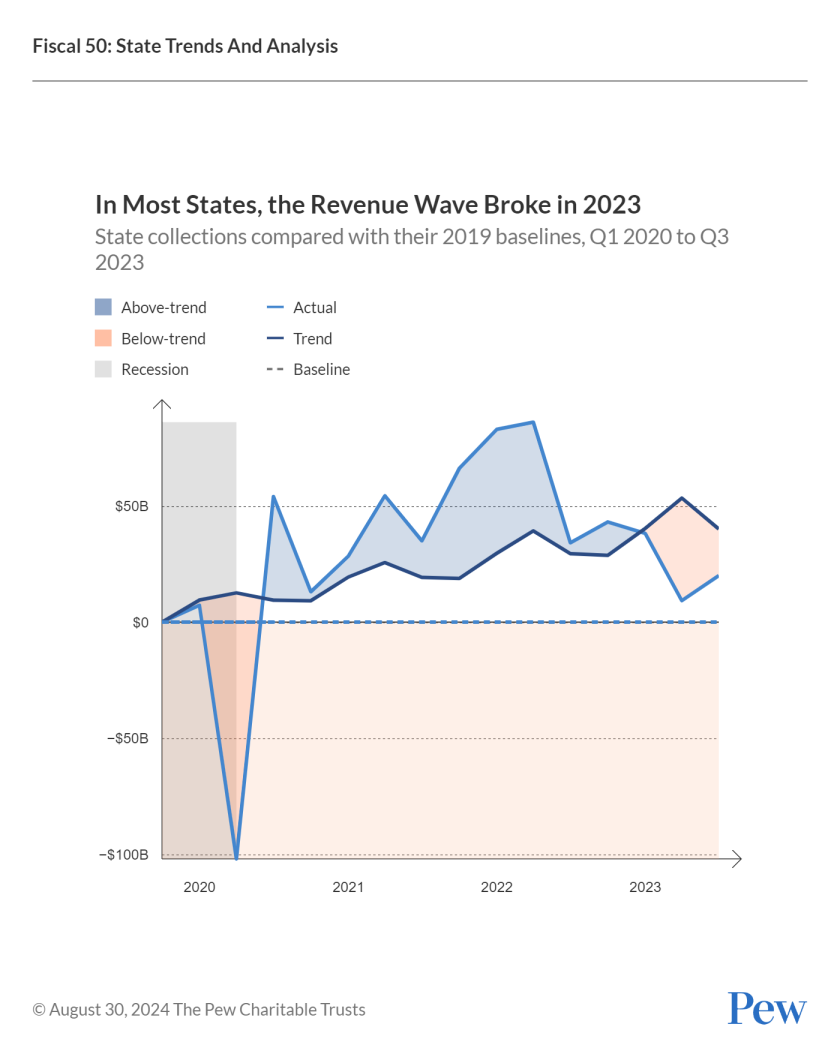
Although the shift from the largest quarterly decline in more than 50 years to the biggest increase initially reads as a shocking recovery, the historic volatility between April and September 2020 was actually somewhat artificial, driven mainly by a shift in the federal tax deadline that significantly affected collections. By the time the revenue wave peaked at the end of 2022, states had collected nearly $500 billion more in revenue than they would have, had revenue growth remained at the 2019 baseline.
The combination of steep declines followed by rapid increases resulted in total inflation-adjusted state revenue growing by $403.6 billion from the start of 2020 through the fourth quarter of 2022, nearly 40 percent higher than what states would have collected had they simply maintained their five-year growth rates over that span. In other words, in just three years, states experienced revenue growth that, had pre-pandemic trends held, would have taken five years.
The degree of divergence from pre-pandemic trends varied widely by state. The size and speed of revenue declines and rebounds were influenced by a combination of each state’s economic makeup, pre-pandemic growth trends, share of jobs that could be performed remotely, reliance on certain types of tax revenue, tax policy changes, COVID-19 caseloads, and public health restrictions. On one end, nearly all (95 percent) of New Mexico’s new revenue during the wave was above trend, followed by 91 percent in Mississippi.
At the other end, Hawaii saw a cumulative decline in revenue during the period, meaning its collections were not only below trend, but also below the state’s 2019 baseline—resulting in a deviation from pre-pandemic trends six times the size of its losses over the time span. The only other states with collections more than 100 percent below trend were Wisconsin (200 percent lower, or a third of what it was previously on track to collect) and Oregon (103 percent lower, or just over half of what it had been on track for).
States with a larger percentage of new revenue that was above trend during the wave had a greater influx of tax growth, compared with states that cleaved more closely to or fell below their trend lines. But all that growth also comes with added risk. The more above-trend revenue a state collected, the more revenue that state is in danger of losing as collections return to and eventually dip below the trend line.
Thirty-five states surpassed their pre-pandemic trend lines over the 12 quarters that spanned the early 2020 recession and ensuing revenue wave. In half of these, above-trend revenue accounted for more than half of their total growth during that period.
Despite the stubbornly strong gains, state budgets during these years remained relatively conservative in their revenue estimates. In fiscal 2021, states’ collectively projected revenue would decline 3.5 percent from the previous year, according to the National Association of State Budget Officers (NASBO). Even when the opposite happened, states still did not anticipate the growth would continue. and instead projected a 2.6 percent drop from 2021’s record high total.
As revenue forecasters repeatedly revised their estimates upward during these years, they also communicated to lawmakers the uncertain and potentially temporary nature of at least some of the revenue growth—such as the move among consumers toward buying taxable goods rather than untaxed services during the pandemic—and underscored the need to proceed with caution. “We do not know how long this pandemic-induced shift in consumer spending will last, so it is important to carefully plan a portion of this budget as a one-time ‘surge’ to address our citizens’ most pressing needs today,” Ohio Office of Budget and Management director Kimberly Murnieks told the House Finance Committee in February 2021. “In fact, it is necessary for our economic recovery that the shift in consumer spending eventually be reversed as spending on services recovers.”
Difficult to Predict
However, because many states lack formal definitions of “one-time” and “ongoing” revenue and do not routinely distinguish between these categories in budget documents, finance officials often had to make ad hoc judgments about how much revenue was temporary.
Complicating matters further, many states enacted historic tax cuts during this period. These policy changes made it harder for forecasters to identify the baseline revenue because tax formulas were not consistent from year to year. For example, Arizona lawmakers in 2022 accelerated the full phase-in of a major personal income tax cut after hitting a revenue target one year early. But even after adjusting income tax revenue downward by $2.3 billion for fiscal 2024, Arizona’s legislative analysts now say the state is facing a $1.7 billion deficit through fiscal 2025 because income tax revenue is falling more than expected.
States also anticipate the timing of revenue shifts in different ways. In 2021, California—which tends to experience economic swings sooner and more dramatically than other states—adjusted its forecasting model. To better anticipate and prepare for potential downturns, forecasters in the Legislative Analyst’s Office, who relied heavily on recent revenue data to project growth, added a predictive lens to their model. The resulting “recession indicator” draws on 50 years of data from diverse sectors, such as unemployment, inflation, home sales, and bond markets.
In spring 2022, the indicator began sending a recession warning signal, which historically has predicted that a downturn will occur in the state within the next two years. Despite conflicting with the office’s traditional forecasting model, which suggested revenue would continue to rise in fiscal 2023, this signal correctly flagged the changing direction of the state’s tax revenue. Before passing the fiscal 2024 budget, California lawmakers needed to close a $32 billion shortfall. A year later, they faced an even bigger gap, resolving a nearly $47 billion shortfall in the fiscal 2025 budget.
When projecting revenue, forecasters and economists also consider the cyclical nature of certain sources, particularly income taxes. “It’s easy to look at these surpluses and think we can just slash taxes or increase spending,” said Bob Buschman, Georgia’s state economist. “But we have to consider whether the surge in revenues is sustainable or is due to temporary or cyclical factors.” Understanding where revenue growth is trending within the economic cycle promotes a longer-term view of a state’s fiscal situation and helps distinguish whether a revenue bump is part of a recurring pattern or an anomaly.
(Source: Pew analysis of data from the Urban Institute and U.S. Census Bureau)
Only Clear in Retrospect
Not knowing how much revenue in any given year is due to a one-time event or economic anomaly can make it more difficult for state budget officers to plan ahead. Many budget officials told Pew that after the pandemic, they could readily identify a host of mostly temporary economic factors, including the influx of federal aid to states, that was driving the revenue wave in their states. But the scope and duration of those factors was less clear.
For the federal pandemic aid, the parameters were well defined. States received more than $800 billion between 2020 and 2022 and used the money to replace tax revenue lost because of the lockdowns and to support schools, housing, health care, and transit, among other. Although the infusion of so much federal money posed some management challenges for states, having a sunset date—Dec. 31, 2026—for most of the funds provided clarity on when that revenue would no longer be available.
However, the same cannot be said for the other factors that contributed to the wave. Changes in taxpayer behavior and other economic and policy developments that led to the surge in revenue did not come with a clear timeline for when—or whether—their effects would ebb, making identifying recurring versus nonrecurring sources even more difficult.
Because a universal approach to calculating the scope of potentially one-time or temporary tax revenue does not exist, states are left to untangle these factors while making revenue projections that also incorporate economic stressors, such as inflation and the impact of global events on specific revenue streams.
If states do not have a clear sense of the staying power of increased tax revenue collections, they risk committing to ongoing tax or spending policies based on funding that has the potential to evaporate. Many policymakers were aware of the temporary nature of the revenue surge, but Pew’s interviews and research indicated that the measures they took to ensure that surplus revenue was either saved or spent on one-time expenditures varied from state to state.
Although the recent tax cuts and spending increases can cloud the picture for budget forecasters, above-trend revenue collections do not need to be seen only as a risk. By making a regular practice of distinguishing between temporary and recurring revenue trends, states can more confidently commit to one-time and permanent expenditures and tax cuts.
Melissa Maynard is a project director with the state fiscal health program at the Pew Charitable Trusts. This article was adapted from a report published by Pew. Read the report here.