

Medicaid covers nearly half of all births nationwide and provides pregnant women with access to critical prenatal, childbirth and postpartum care. For children, Medicaid or Children's Health Insurance Program (CHIP) coverage offer access to preventive care, routine checkups and interventions that support positive long-term health and socioeconomic outcomes. Medicaid is also the primary funder for long-term services and supports, including home health care and nursing home facilities, that many older adults and people with disabilities rely on to maintain their health and quality of life.
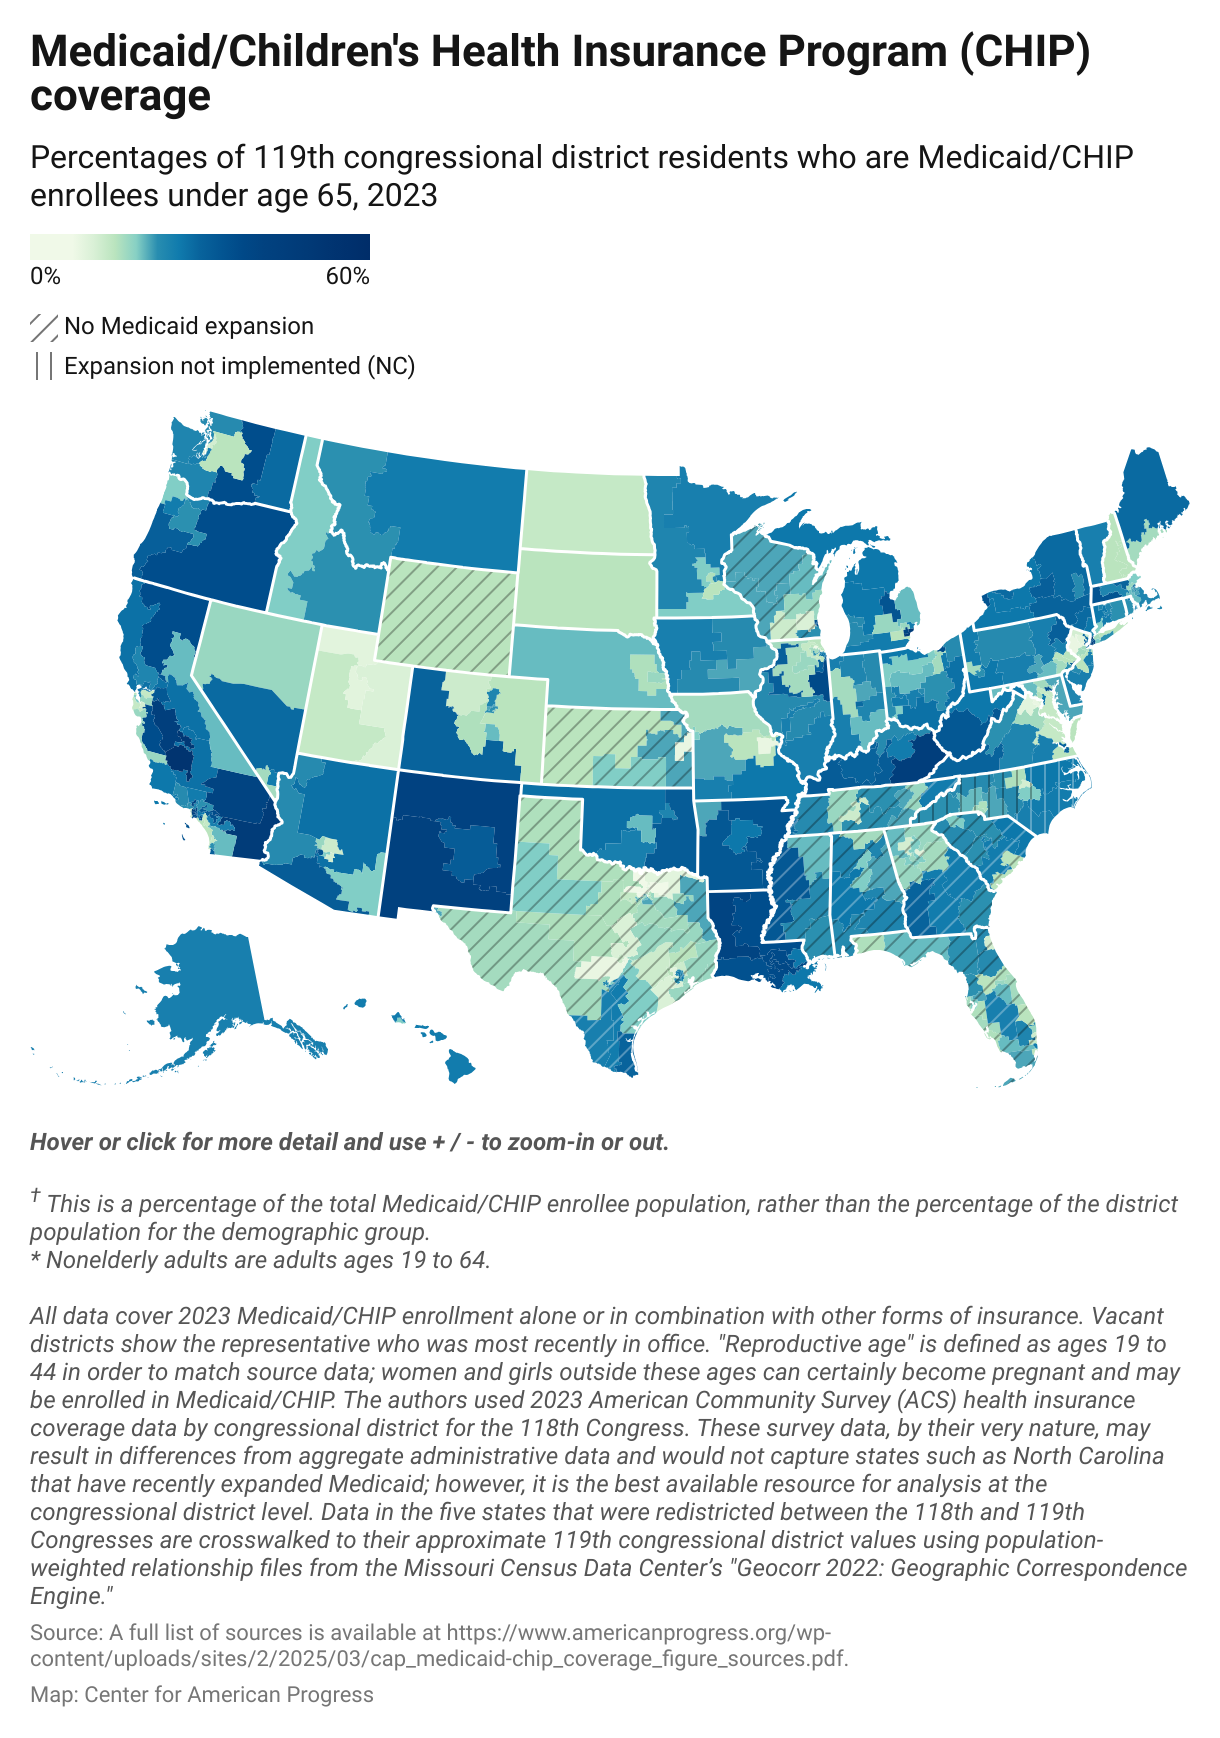
This article provides estimates of enrollment in Medicaid and CHIP by congressional district, using 2023 data from the U.S. Census Bureau’s published tables of the American Community Survey.* The number and demographic makeup of local Medicaid and CHIP enrollment populations vary across the country due to differences in local demographics and state eligibility thresholds for the programs.
Who Would Medicaid and CHIP Cuts Hurt?
The Medicaid program is under significant threat. On Feb. 25, House Republicans passed a budget resolution instructing the House Energy and Commerce Committee to make at least $880 billion in budget cuts through 2034. Mathematically, these cuts would have to come primarily from the Medicaid program, since President Donald Trump has promised Medicare cuts are off the table. In fact, there is only around $500 billion in non-Medicare or Medicaid funding under the committee’s jurisdiction. Additionally, of that $500 billion, about $180 billion is CHIP.**
In other words, an $880 billion reduction to Energy and Commerce Committee spending would have to cut the Medicaid program, which would force millions of people off of their health insurance.
After the House and Senate agree to a shared budget framework, legislators will begin the task of figuring out how to cut the Medicaid program in order to achieve targeted spending reductions. Any reductions in Medicaid spending would result from reductions in coverage or benefits for eligible enrollees. Some options that Republican leadership have raised include adding burdensome paperwork requirements for working people to prove that they have jobs; shrinking the Federal Medical Assistance Percentage (FMAP) that provides states with matching funds to finance their Medicaid programs; or converting federal support to block grants. Although it is difficult to project the precise impact on Medicaid enrollment without specific policy proposals for these cuts, these policies could affect any number of the people outlined in the data below, even if they are presumed to be carved out of these proposals.
Do Work Requirements Work?
One way House Speaker Mike Johnson and other Republicans have proposed reducing Medicaid funding is by imposing burdensome work requirements on program enrollees, rendering millions ineligible for coverage and discouraging eligible individuals from signing up for coverage.
Evidence has consistently demonstrated that requiring Medicaid enrollees to prove they are working or to report hours worked does nothing to increase work. Instead, such requirements kick hardworking individuals off of the Medicaid assistance for which they are eligible. For this reason, in 2024, the U.S. Department of Health and Human Services general counsel issued an advisory opinion stating that work requirements conflict with Medicaid’s core mission to provide health coverage to eligible individuals. For people working in seasonal jobs, such as construction or agricultural labor, the burden associated with work requirements paperwork and procedural red tape is even more pronounced. Furthermore, work requirements can only deliver budgetary “savings” by taking away people’s health care.
Additionally, work requirements are a significant source of administrative waste. Georgia’s Medicaid waiver program that included work requirements, known as Pathways to Coverage, illustrates this point. In 2024, the program cost taxpayers more than $86 million for the state to administer, yet out of 345,000 people projected to be eligible for the program in 2022, only slightly more than 6,500 made it through the red tape to enroll in 2025. A ProPublica investigation found three-quarters of the $86 million spent on the program instead went to consulting firms such as Deloitte, which received more than $50 million in taxpayer funds to build out software for eligibility applications and work reporting requirements.
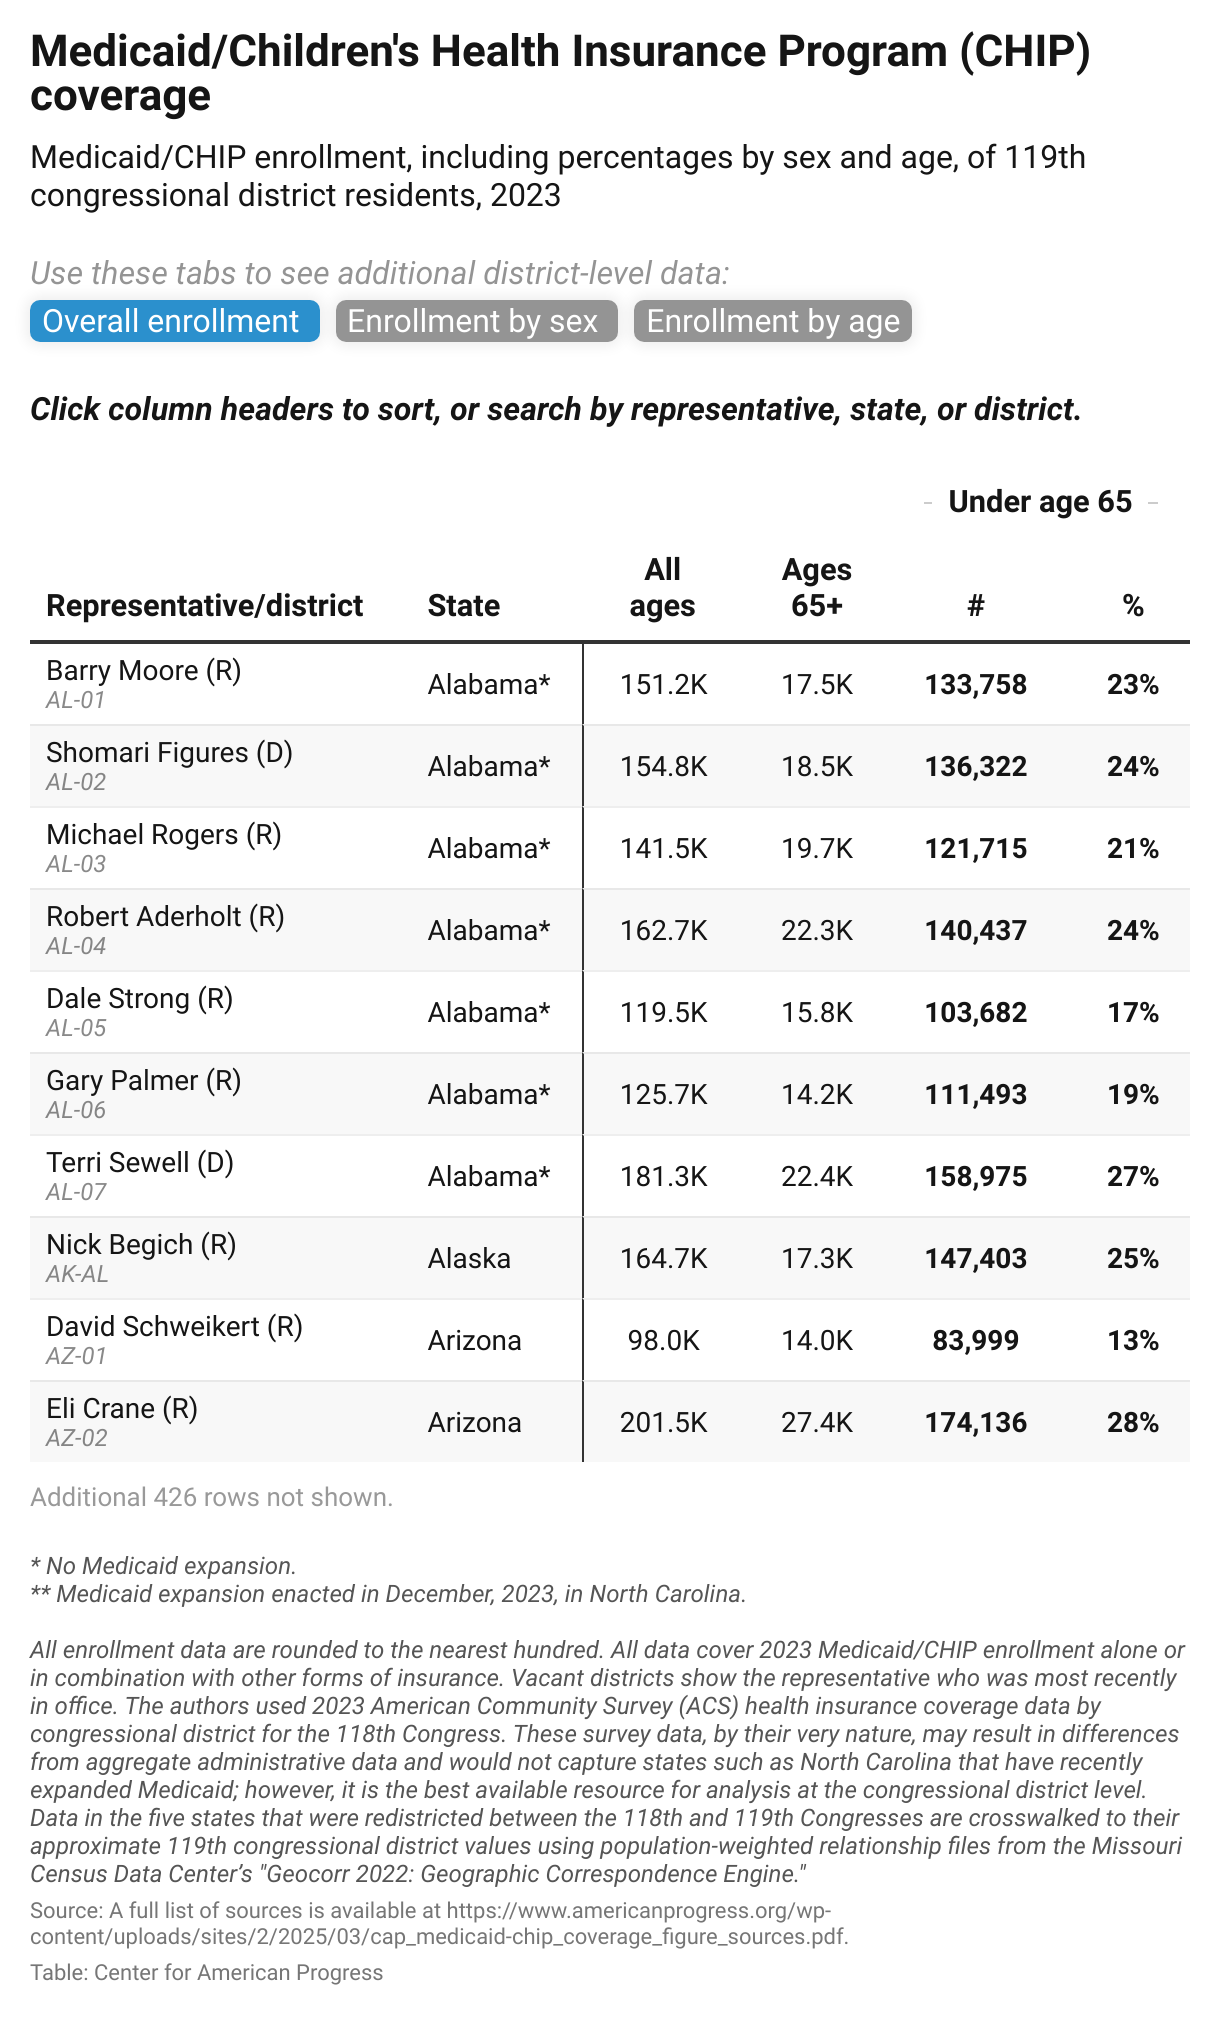
See an interactive table that lists Medicaid/CHIP enrollment by congressional district here.
Who Is Enrolled in Medicaid by Sex?
Women are more likely to be covered by Medicaid than are men, which is in part due to patterns of disability status by gender, as well as women’s lower incomes due to structural barriers to employment and earnings including the gender wage gap and occupational segregation. Women’s higher likelihood of disability is generally attributed to their longer lifespans. As women age, they are more likely to fall into the group that may need Medicaid Long Term Care (LTC). In Tennessee’s 9th Congressional District, where the population has a larger gender imbalance higher than average share of enrollees over age 65, more than half (58 percent) of Medicaid/CHIP enrollees are women or girls.
Women are also more likely to take on caregiving roles ror their families, which can often result in their scaling back work hours or not working in the formal sector. This, too, results in lower earnings overall, and makes it more likely for women to work part time or part year than do men, all of which increases their likelihood of qualifying for Medicaid. Medicaid work requirements targeting part-time or part-year workers would therefore inherently have a disproportionate impact on women, particularly for single mothers, of whom about 40 percent are estimated to be covered by Medicaid, CHIP or other means-tested health care.
Finally, pregnant women have different eligibility qualifications for Medicaid and CHIP than other adults. Kentucky and West Virginia, for example, have some of the highest income thresholds (300 percent of the federal poverty level) for pregnant women on CHIP. It therefore comes as no surprise that Kentucky's 5th District is in the top five districts for the share (45 percent) of reproductive age women on Medicaid or CHIP.
In 2023, 41 percent of all births in the United States were financed by Medicaid. In some states, such as Louisiana, nearly 2 in 3 births were covered by Medicaid, as were more than half in New Mexico. This maps closely with the estimates by congressional district. In Louisiana’s 4th Congressional District, 41 percent of reproductive age women were covered by Medicaid in 2023.
Who Is Enrolled in Medicaid by Age?
Children (ages 0 to 18)
Children can qualify for CHIP up through age 18 and make up nearly half of all Medicaid/CHIP enrollees nationally. Like pregnant women, children are subject to more generous eligibility thresholds — for example, up to 318 percent of the federal poverty level in New Hampshire — though these thresholds vary somewhat by age. In some districts, as many as 3 in 4 children are enrolled in Medicaid/CHIP; in California’s 22nd Congressional District, nearly 75 percent of children under 6 years old were covered by Medicaid/CHIP in 2023.
Nonelderly adults (ages 19 to 64)
Approximately 16 percent of nonelderly adults were covered by Medicaid/CHIP nationwide in 2023. In some districts, however, that percentage was significantly higher; for example, in Kentucky’s 5th District, 38 percent of nonelderly adults were covered by Medicaid in 2023. In the 15th Congressional District of New York, an area with especially high levels of poverty and therefore high Medicaid eligibility across all age groups, more than half of all nonelderly adults were covered by Medicaid.
Older adults (age 65 and older)
About 14 percent of adults over age 65 had Medicaid coverage in 2023, nearly all of whom were dually eligible for Medicare. For older adults who qualify for both programs, Medicaid can be used to pay for Medicare insurance premiums or prescription drugs. Some older adults are eligible for Medicaid for long-term care due to disabilities that require help with daily living activities such as bathing and eating.
Many of the districts highlighted in the data above also have high shares of older adults on Medicaid in their districts. Interestingly, Florida’s 27th Congressional District has a much lower than average share of working-age adults on Medicaid, at only 9 percent, but a larger than average share of older adults on Medicaid, at 32 percent. This area, which covers south and west Miami, contains a large number of retirement communities where low-income seniors could be put at risk by proposals to cut Medicaid spending.
Conclusion
As this data shows, Medicaid and CHIP serve vastly different types of populations depending on state eligibility thresholds and the demographics of the congressional district. In some districts, such as those in south Florida, a large number of Medicaid enrollees are people over 65, while in the Bronx borough of New York City, children make up the majority of the Medicaid and CHIP population. This has implications for who would be harmed the most by House Republican proposals to reduce federal spending among programs in the Energy and Commerce Committee, specifically by cutting the Medicaid program.
*Administrative data will differ from the U.S. Census Bureau survey estimates due to the time period, data collection methods and the December 2023 enactment of Medicaid expansion in North Carolina.
**Authors’ analysis of CBO baseline.
This article was published by the Center for American Progress. Sara Estep is an economist, Natasha Murphy is director of health policy and Andrea Ducas is vice president of health policy at the Center for American Progress.
The authors would like to thank Kennedy Andara and Amina Khalique for fact checking; Emily Gee, Lily Roberts, Madeline Shepherd and Ben Verdi for their feedback; and Bill Rapp for his design work on the data interactives in this column.