New research seeks to answer that question. Using data from the W.E. Upjohn Institute for Employment Research, researchers at North Carolina State University tallied all incentives offered by 32 states from 1990 to 2015, effectively covering 90 percent of incentives nationally. What they found doesn’t portray incentives in a positive light. Most of the programs they looked at -- investment tax credits, property tax abatements, and tax credits for research and development -- were linked with worse overall fiscal health for the jurisdiction that enacted them.
“It’s not that incentives are bad or that we shouldn’t use incentives,” says Bruce McDonald, an NC State associate professor who led the research team. “But if a state or local government is going to provide an incentive, there needs to be some kind of clarity on what the realistic expectations are for what they might get back.”
The forthcoming study represents what’s likely the first large-scale national analysis examining how various incentives influence state finances. To assess fiscal health, McDonald’s team considered three measures: state debt, dependence on the federal government as a source of revenue, and the ratio of total expenditures to revenues. They further controlled for 17 other factors, including economic growth, demographics and political party control.
The incentive most associated with weaker state fiscal health across all metrics was research and development tax credits. McDonald says this is because R&D, when successful, generates broader effects on the national economy but may leave the individual communities in a sponsoring state out of the boom.
The study found a smaller negative fiscal effect from property tax abatements, which include states’ picking up the bill for corporate relocations. As governments abate property taxes, they become increasingly reliant on income taxes, sales taxes or other more volatile sources of revenue that pose greater risks for budgets.
Job-creation tax breaks -- accounting for the single largest portion of total incentive spending -- didn’t yield a statistically significant relationship with fiscal health. “It might be that the new people employed are providing a positive contribution back to the state through the taxes,” McDonald says, “but I suspect it becomes a wash as the taxes pay back what was spent on the incentives.”
Nationally, tax incentives as a share of state and local business taxes nearly tripled between 1990 and the early 2000s, according to Upjohn Institute research. More recently, that number hasn’t fluctuated very much. Some states have curbed their awards while others have become more aggressive, keeping the aggregate share roughly the same.
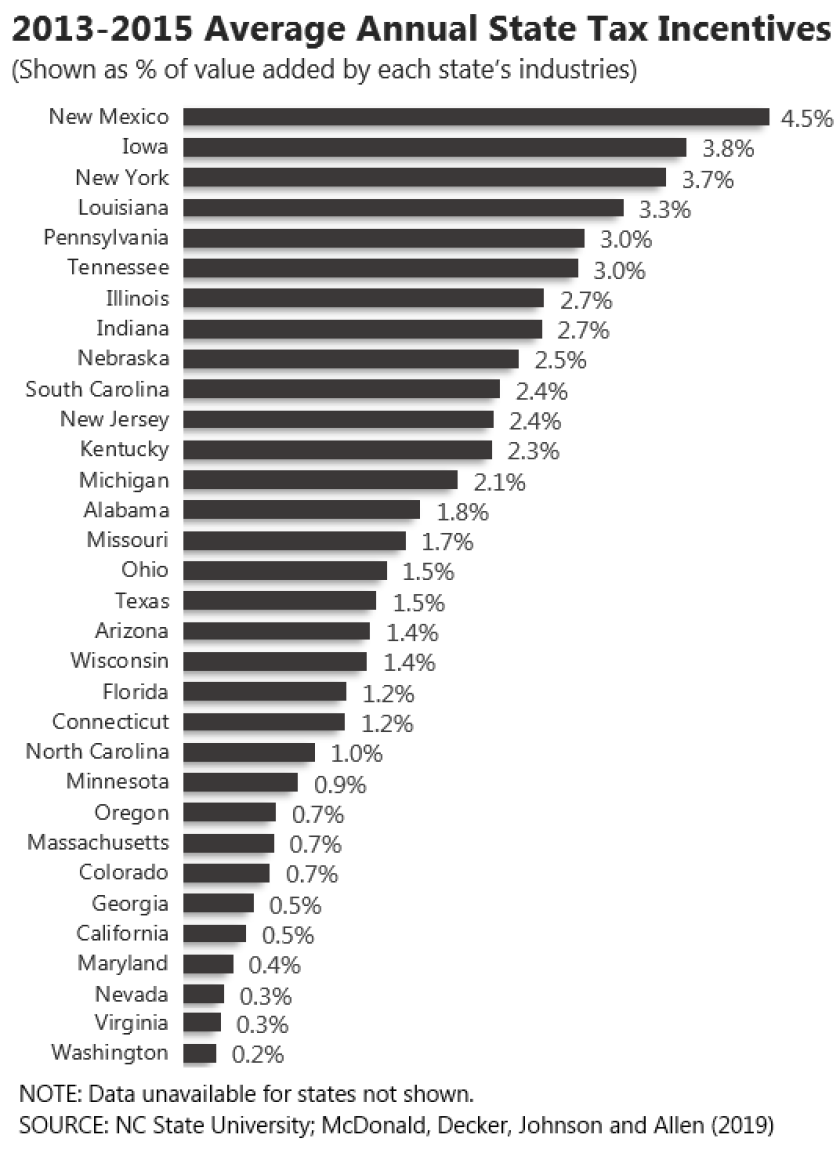
Of the states McDonald’s team studied, those relying most on financial incentives between 2013 and 2015 were Iowa, Louisiana, New Mexico, New York and Pennsylvania. (The study measured incentives as a percentage of the value added by a state’s industries, which represents the value of products produced beyond costs of materials.) In terms of weakened fiscal health, the state with the highest average ratio of expenses to revenues was Alabama, followed by Kentucky, Louisiana, Massachusetts and Pennsylvania. Nevada and Oregon, two states with especially strong economic growth in recent years, recorded the most favorable ratios.
States can better predict expenses by regularly forecasting and monitoring incentive programs. They can control costs in a number of ways, such as by setting caps, requiring companies to meet specific benchmarks, and funding incentives through budget appropriations rather than open-ended commitments, recommends Mark Robyn, who studies incentives at the Pew Charitable Trusts.
Certainly, incentives may generate new tax revenue from economic activity. But it’s important to consider that this comes at a cost, as new jobs and other gains result in greater demand for government services. “When considering incentives,” Robyn says, “policymakers should also be aware of the full range of budget impacts beyond the ‘sticker cost’ of the incentive.”


